I found context-mode on GitHub while looking for ways to stretch Claude Code sessions on a large Laravel codebase. The pitch: instead of dumping raw file contents into the context window, it indexes your project into a local SQLite database with full-text search. Claude queries only what it needs. Less context bloat, longer sessions, lower usage.
I ran three benchmarks against my own production SaaS. The tool did exactly what it promised — it kept data out of the context window. But my plan usage went up every time.
Here's the data.
Test 1: A single Blade component edit
Prompt: change a contact form's post-submission behavior from an inline success message to a route redirect. One file, maybe 100 lines.
Without MCP: plan usage went from 14% to 19%. +5%.
With MCP: plan usage went from 19% to 24%. +5%.
Zero difference. For a single small file, the overhead of the MCP intercepting and indexing the content costs exactly as much as letting Claude read the raw text directly.
Test 2: A GitHub research task
I grabbed one of context-mode's own example prompts: research the modelcontextprotocol/servers repo — architecture, tech stack, top contributors, open issues, recent activity.
Without MCP: 24% → 33%. +9%.
With MCP: 33% → 36%. +3%.
The MCP actually helped here. A 3x reduction in plan usage on a research-heavy task that pulls data from multiple sources. The tool had something meaningful to index and filter.
But then I tried something harder.
Test 3: A full subscription system audit
This is where I expected the real payoff. I asked Claude to analyze the entire subscription architecture of Vlinqr — my multi-tenant SaaS platform. The prompt asked it to map every Model, Controller, Middleware, and Service Class involved in the subscription system, trace how a tenant moves from trial to active, document where Stripe webhook logic is handled, and list all dependencies for a phased refactor.
First attempt (broken paths)
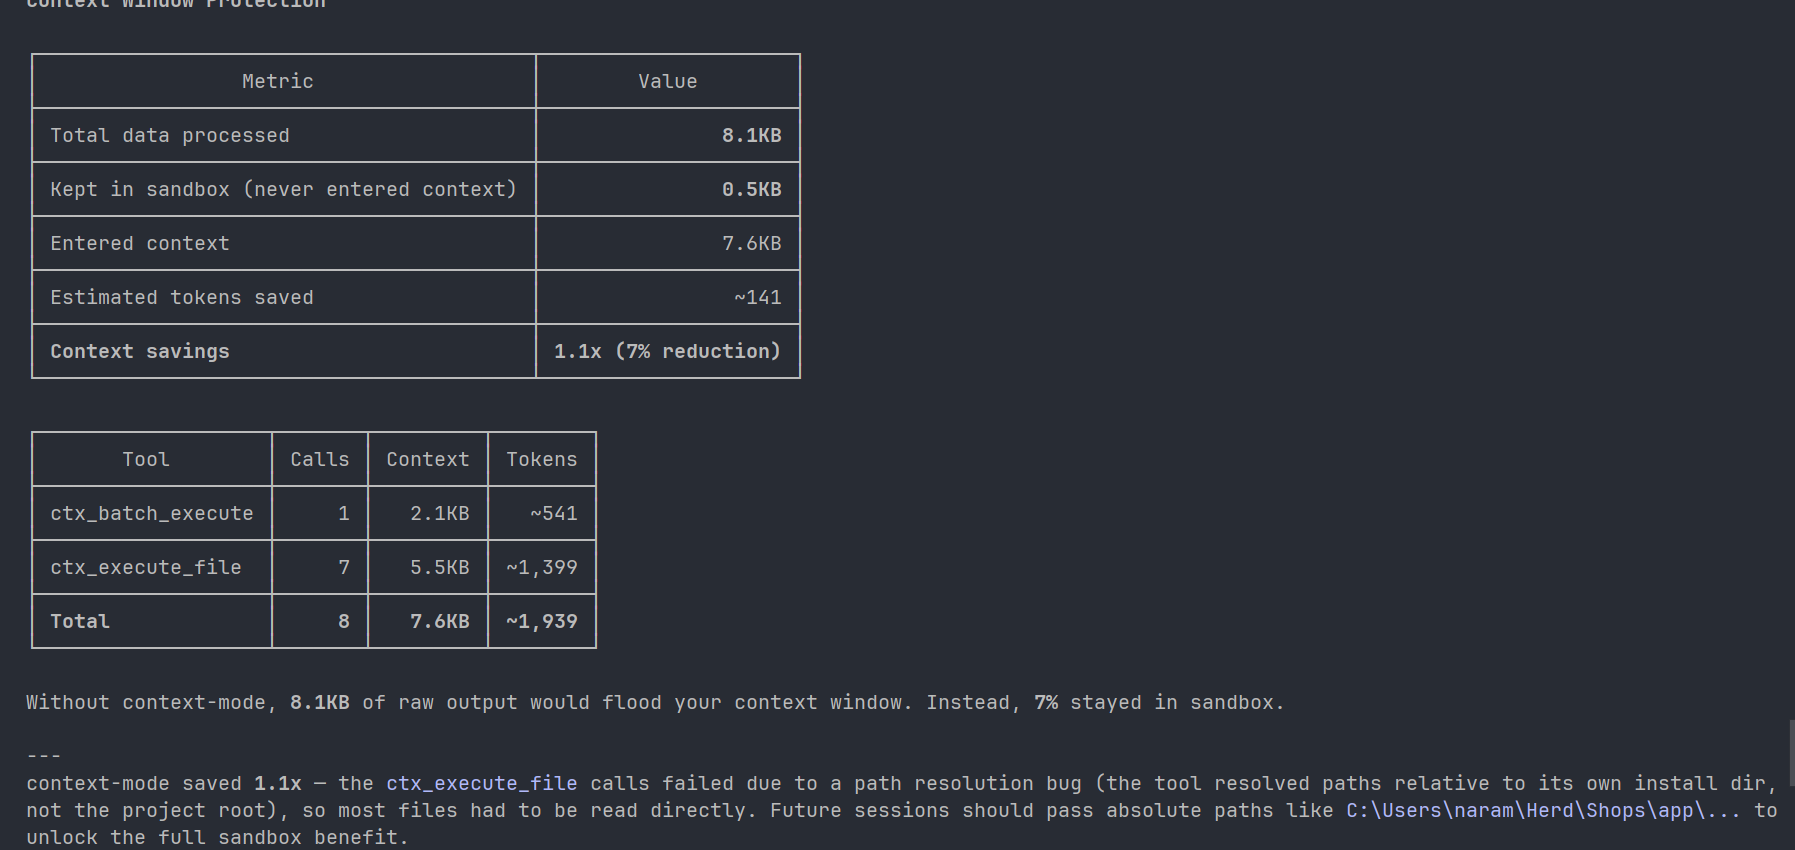
The MCP failed to index properly because it resolved file paths relative to its own install directory instead of the project root. The ctx-stats report told the story: 8.1KB total data processed, only 0.5KB kept in sandbox, 7% reduction. Basically useless.
Plan usage reflected it:
Without MCP: 36% → 44%. +8%.
With MCP: 44% → 58%. +14%.
The MCP cost almost double with no benefit. Lesson: always pass absolute paths .
Second attempt (paths fixed)
After upgrading the plugin, the indexing worked properly. The stats looked good:
Metric | Value |
|---|---|
Total data processed | 482.7 KB |
Kept in sandbox | 144.3 KB |
Entered context | 338.4 KB |
Estimated tokens saved | ~36,942 |
Context savings | 1.4x (30% reduction) |
The tool made 16 tool calls (13 ctx_batch_execute, 2 ctx_execute, 1 ctx_stats) and consumed ~86,627 tokens through those calls.
Plan usage: 77% → 87%. +10%.
Compare that to the without-MCP run: +8%.
The MCP saved ~37,000 tokens from the context window and still cost more overall.
Why saving tokens costs more tokens
Context-mode does what it advertises. It keeps raw file data out of your context window. The problem is that "context window usage" and "plan usage" measure different things.
The system prompt tax
Every MCP server registers tool definitions (name, description, parameter schema, return types) that Claude needs in context to know the tool exists. Those definitions persist for the entire session. That's how the protocol works — Claude can't call a tool it can't see.
I don't know the exact byte size of context-mode's injected definitions. But the pattern across all three tests is consistent: the MCP adds a fixed cost floor before you even send your first prompt.
Tool call overhead
Without an MCP, Claude reads a file in one action. With context-mode, it plans a query, executes a tool call, reads the SQLite return, synthesizes the result. In the Vlinqr audit, that happened 16 times. Each call generates input and output tokens that count against the plan.
The ctx-stats report says ~86,627 tokens were consumed by tool calls alone. That's the round-trip cost of the MCP "thinking out loud."
The output quality question
I compared both Vlinqr audits side by side. They're closer in quality than I expected.
The standard audit (without MCP) caught the major architectural risks: the dual subscription mode complexity (local and Stripe subscriptions sharing one table), a status service that had become a god object injected everywhere, a missing scheduler for an expiration command, and a manual period sync that could drift from Stripe's actual data.
The MCP audit caught those same issues plus two things the standard audit missed: a mass-assignment violation in a local subscription creation method, and a latency risk where a model's saved hook was making a live Stripe API call on every write. That second one matters — every webhook-triggered update would hit the Stripe API synchronously, which could cause timeouts under load.
Real catches. But the improvement is incremental, not transformational.
When to turn it on
Leave it off for single-file edits and short sessions. The system prompt tax makes it a net negative when Claude only needs to touch one or two files.
Turn it on when you're doing multi-file analysis on a large codebase across a long session. The 30% context reduction doesn't save you money on one prompt, but it might be the difference between a session that stays coherent at prompt fifteen and one that starts hallucinating file names.
The tool's value isn't in reducing your bill. It's in extending how long a session stays useful before context collapse.
These benchmarks are from one codebase and one MCP. If you've run similar tests or spotted a flaw in my methodology, I'd like to hear it.